
Species guide
Red Oak: what the numbers tell you.
What one lab study can tell you about Red Oak—and what it cannot.
Direct answer
One lab study found an average Janka result of 6.1 kN for Red Oak. The test values ranged from 3.8 to 10.5 kN. That shows wood can vary from board to board. It does not tell us how one floor will wear.
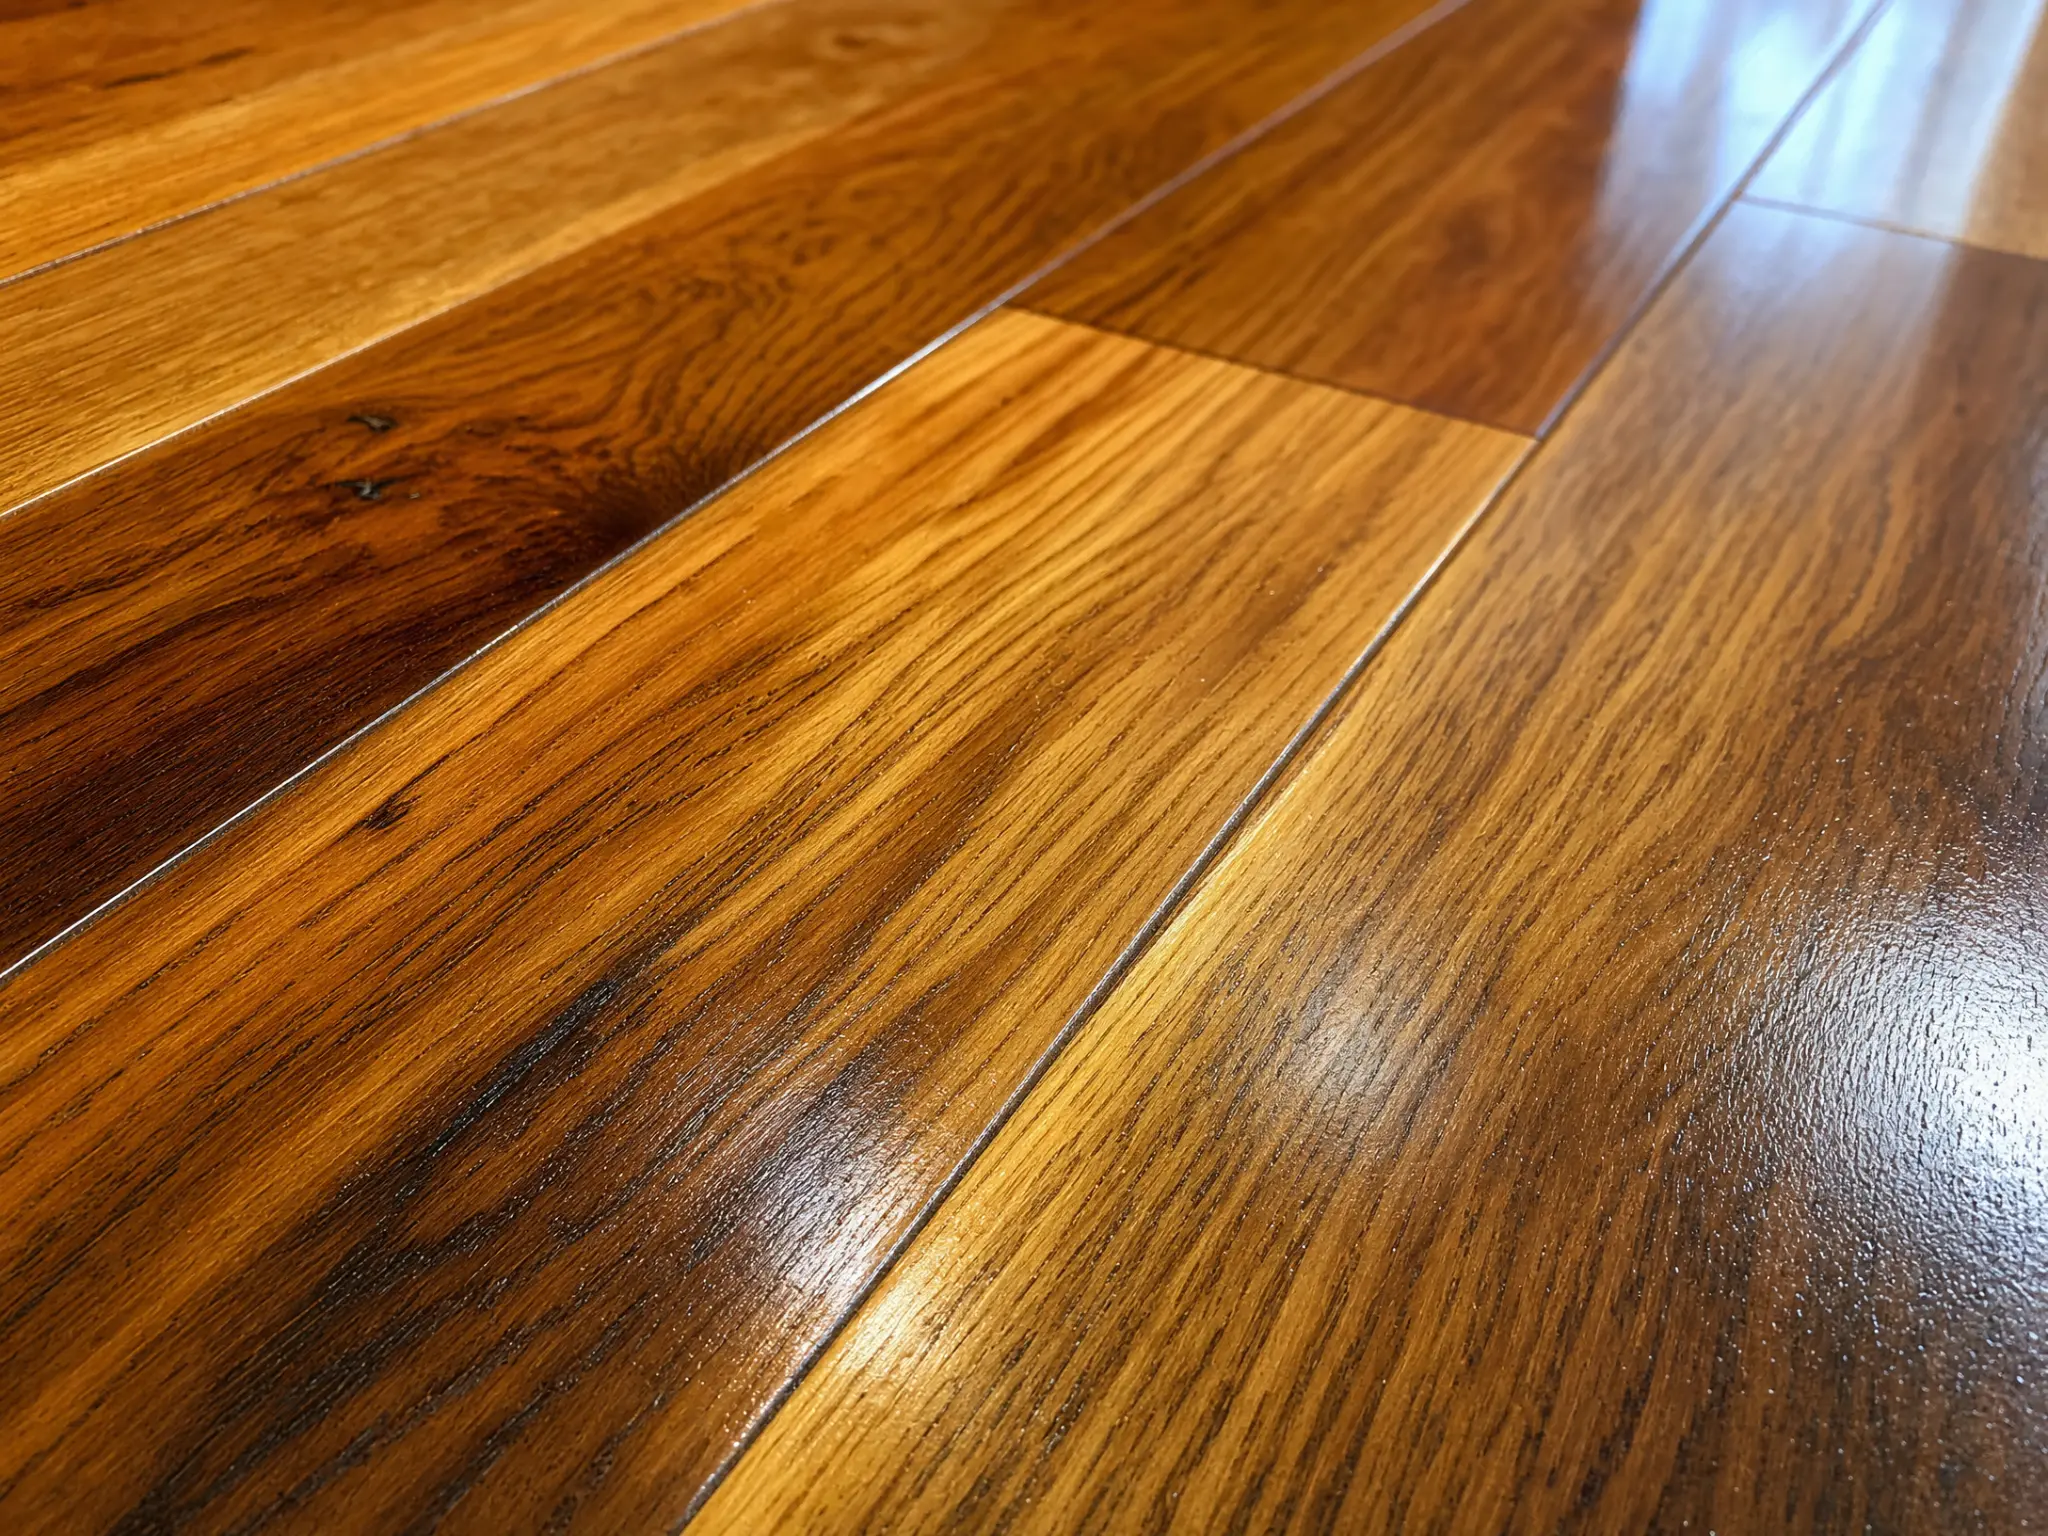
See the wood, then read the numbers
A photo can show character. It cannot prove the species.
Use the measured record below to compare the named wood. Then compare real samples in the room where the floor will live.
How to read these figures
The study tested clear wood in a lab. It did not test a finished floor in a home. The numbers can help compare test samples. They cannot tell us what your floor needs.
Sources & methodology Peer-reviewed measurements and study context
These figures come from clear-wood laboratory data in the cited peer-reviewed study. They help you compare species; your own floor’s construction, finish history, and condition still matter.
| Metric | Reported value | Context |
|---|---|---|
| Density | 699 kg/m³ mean | Study range: 571–853 kg/m³ across sampled boards. |
| Specific gravity at 12% moisture content | 0.65 mean | Study range: 0.54–0.77. |
| Averaged Janka hardness | 6.1 kN mean | Study range: 3.8–10.5 kN across radial/tangential test results. |
| Static bending MOE | 12,211 MPa mean | A clear-wood stiffness measurement, not an installed-floor performance guarantee. |
| Static bending MOR | 120 MPa mean | A clear-wood bending-strength measurement, not a service-life prediction. |
Reviewed October 6, 2026. The paper measures clear wood in a lab. At your visit, we look at the real floor, room, and project plan.